Event Source your Spreadsheets for Flexibility and Maintainability
Event Sourcing (ES) is one of those software paradigms that I wish I had known about much earlier. In hindsight several of my projects and companies would have benefited greatly from an Event Sourced Architecture.
Event Sourcing is, by no means, a magic bullet. It’s an architecture that has a place and use. But for many spreadsheets it turns out to be an excellent fit!
Spreadsheets are notorious in how they evolve and accumulate logic over time, so applying some best-practices and even architectural patterns up front, helps a lot in keeping the spreadsheet maintainable and extensible.
(Whether or not you should use a spreadsheet in the first place, is a whole different discussion. The answer is quite often “nope”, in my experience. But let’s assume we checked the alternatives and found: yes, this a good one for a spreadsheet, because [insert reasons])
For example, I’m tracking my investment portfolio in Google Sheets. Or maybe you need a quick dashboard summarizing the sales you make in various e-commerce platforms.
In such cases, it really helps to set up the sheet “Event Sourced”.
Event Source What?
Event Sourcing ensures that all changes to application state are stored as a sequence of events. Not just can we query these events, we can also use the event log to reconstruct past states, and as a foundation to automatically adjust the state to cope with retroactive changes. Martin Fowler
That’s it! That is everything there is to know about Event Sourcing: all the rest is implementation detail. Concepts like Domain Aggregates, CQRS, Commands, Command Handlers, Snapshots, Projections, and so forth, which you’ll often see when reading about Event Sourcing, are implementation details. Necessary details when implementing Event Sourced architectures and to keep code maintainable, solve common problems or avoid some downsides.
But for the sake of understanding why Event Sourcing is useful, the only important part is “application state is stored in a series of events”.
To explain with an example: the balance on your bank-account isn’t a column in
a database table called balances, it’s the sum of the amounts on each payment
and deposit ever done on that bank-account: the events are the source, your
balance is just a derivative thereof.
Event Sourcing is nothing new, it’s actually really old, probably thousands of years. Bookkeeping has been done by writing a log of events, for centuries, since as long as it exists, really. But also domains like shipping works like this; since ages the captain keeps a “captain log”.

One important detail often used in Event Sourcing, is the so-called projection. As said, this is an implementation detail, but one that we can use for the spreadsheet version very well too.
A common scenario in this context is taking events created in the write model […] and calculating a read model view (e.g. an order summary containing the paid invoice number, outstanding invoices items, due date status, etc.). This type of object can be stored in a different database and used for queries.
Event Source introduction by EventStoreDB
In other words: projections are read-only tables containing summaries,
conversions from (subsets) of the events. The balance mentioned above, might
very well be stored in such a projection, called customer_balances, in reality.
So to avoid having to loop through all the 8000+ transactions you made in your
bank account on each tap in your banking-app. Sometimes these are called
“caches”, since they very much act as a cache: they can be re-built from all
events at any time, and might be out of data (eventual consistent) at moments.
Spreadsheets
When designing a spreadsheet, it really pays off to follow some best practices. One is to have only one single, obvious, place where to insert data.
In practice, such data most often comes from CSV files, exports, or, indeed, logs. Banks, Brokers, E-commerce, Bookkeeping, Project-management: most such systems have an export. And with almost all, those exports are some form of “list of things that happened”: a list of events!
So. When we insert data, it makes a lot of sense to make the entry a literal copy-paste of that export[1].
If we then agree this sheet is “append only”[2], we are done: we have an Event Source! We now have a sheet that holds the history of the things that we wish to track. We can add new entries to the bottom[3] and we can calculate all the numbers and summaries that we want from here.
Dashboards, cross-references, enrichments, all can be done by referencing and querying this one sheet.
Downsides
Apart from the fact that spreadsheets in itself are quite often the wrong tool for the job, this setup has some clear disadvantages though.
For one, we need quite complex lookups. The formula’s to calculate a sum quickly become quite complex when it needs to filter certain events only, or group by certain event attributes. But we’ll look at some solutions below.
Spreadsheet’s are very good at 2-dimensional data, but at handling more complex data. If, say, an order contains multiple products, it is often represented in a clumsy way: for example one row per product but each row repeats the order-number, customer-data and so on.
| Date | order# | Price | Product | Customer |
|---|---|---|---|---|
| 02-12 | R1337 | 1.99 | Banana | b_@e_com |
| 02-12 | R1337 | 0.99 | Apple | b_@e_com |
| 04-12 | R8008 | 0.99 | Apple | d_@e_org |
Or worse, the repeated rows leave those fields empty, and only the first holds it.
| Date | order# | Price | Product | Customer | Total |
|---|---|---|---|---|---|
| 02-12 | R1337 | b_@e_com | 2.98 | ||
| 02-12 | 1.99 | Banana | |||
| 02-12 | 0.99 | Apple | |||
| 04-12 | R8008 | d_@e_org | 0.99 | ||
| 04-12 | 0.99 | Apple |
In both cases, we really have data in more dimensions: one order has many line-items (products). In both cases, the event really is only the placement of the order, (order placed event) and not the rows describing the contents of that order.
This mismatch is quite impossible to solve easily; it’s a limitation of spreadsheets. But becomes more apparent when we wish that the copy-pasted-data-entries really were the events, and not “events and then some contents of the events”.
And then that “Transactions2010020114:32.CSV” that I download from my creditcard supplier, or the “Account%20History.csv” that my stock-broker provides often includes several types of events in one table. In those cases, I need even more complex queries over the events, as every query needs to filter out specific events only.
When there are many events, thousands or more, things get slow. Or even impossible[4].
As with the dimensions of data, Spreadsheet software often shows that it isn’t
really designed for such a setup. It often lacks details or requires hacks and manual work.
For example, when enriching data, you’ll probably need complex IF(ISEMPTY(),
0, THEACTUALFORMULA) just to avoid pesky “#N/A” errors, which will
trickle through everywhere. Or a hard-coded range (you will insert an A2:A1001,
for certain) that now gives the wrong data because you just
inserted event 1002.
Those limitations are there even if you don’t set you sheets up Event Sourced, just that they are more annoying when you try to set it up flexible, future-proof and maintainable.
Demo!
The details, some best practices and more background can best be explained with an example. As demo, I prepared a Google Sheet, and shared it. (feel free to leave your comments in this sheet if you see improvements)
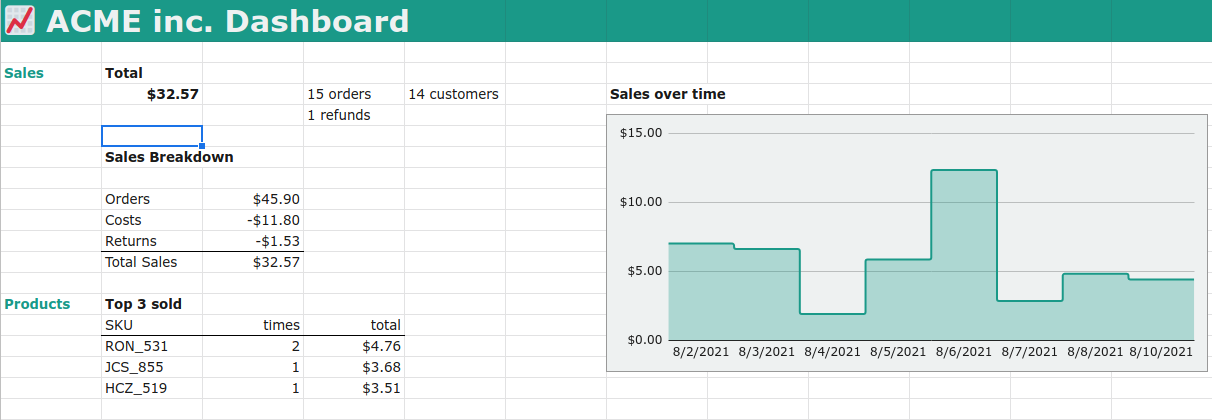
This demo is a “dashboard” for small e-commerce business. It contains both a sample data-set. I deliberately kept the list short, so that we can see and cross-reference what happens. The data-set is modelled (very loosely) after how an e-commerce platform offers their exports. They are sales and refunds. This would be a table into which we can append, by copy-pasting, our monthly downloaded CSV entries from this platform.
The Events
One tab is called “events”. This is the place where we append new entries as they come a in a download. Our demo has one source of events, but often you’ll find that you want to include multiple sources. For examples sales made on Etsy and sales made on Shopify. The exports from these places will not be compatible. It is then a bad idea to mix these up in one “events” tab. Instead, it is far cleaner to have multiple “event entry tabs”, e.g. “etsy_events” and “shopify_events”. This trick also works for when exports’ formats change in future. A provider may (and you can be certain at least one will!) change the export format without being backwards compatible. Adding or removing columns, changing the format etc. In that case I’ll just add a new tab “v202203_events” or so.
There is no deduplication nor an easy way to deduplicate. So, if on, say February 5th we download the entries for “this year”, copy paste them, and then in April we download the entries for Q1, we will have all events from Jan 1st to Feb 5th double.
The obvious solution is to just not enter double events. But if we need a solution for this, I’ll touch on one further below. Some exports don’t allow you to provide a date-range, there the same goes: just be sure to copy-paste only the new stuff.
A sample from the data to describe some of the Domain Logic around these events
| DateTime | SKU | order_id | customer_name | customer_email | cost_basis | sale_price | costs | currency | type |
|---|---|---|---|---|---|---|---|---|---|
| 2021-08-02T03:00:50Z | KJC_559 | R71218 | Jameson Mayhew | jmayhewkv@usgs.gov | 1.46 | 2.03 | 0.73 | EUR | sale |
| 2021-08-02T09:34:36Z | AGY_380 | R71218 | Jameson Mayhew | jmayhewkv@usgs.gov | 1.21 | 2.04 | 0.87 | EUR | sale |
| 2021-08-02T14:52:44Z | HCZ_519 | R68804 | Ignaz Vallerine | ivallerine50@cornell.edu | 0.35 | 3.51 | 0.22 | USD | sale |
| 2021-08-03T03:19:36Z | UNP_232 | R68804 | Ignaz Vallerine | ivallerine50@cornell.edu | 1.6 | 1.53 | 0.13 | USD | sale |
| 2021-08-03T11:29:12Z | DHQ_687 | R68804 | Ignaz Vallerine | ivallerine50@cornell.edu | 1.37 | 2.29 | 0.68 | USD | sale |
| 2021-08-03T13:59:03Z | SVQ_548 | R73703 | Lorens Gulleford | lgullefordl5@instagram.com | 0.86 | 3.41 | 0.08 | EUR | sale |
| 2021-08-06T12:15:00Z | UNP_232 | R68804 | Ignaz Vallerine | ivallerine50@cornell.edu | 0 | -1.53 | 0.15 | EUR | refund |
| 2021-08-06T07:24:36Z | RON_531 | R19813 | Roz Cossar | rcossarc2@smh.com.au | 0.35 | 2.38 | 0.79 | EUR | sale |
The data is duplicated, a unique OrderId describes an order, but additional rows describe additional products in that order. We have a type column which describes the kind of event.
In domain-language, we see Jameson having placed an order for two products for a total of 4.07 (this amount is not included!). The product has some costs attached for us (dropshipping fee, the costs to make it, or to buy it). We see that some products were bought in EUR, some in USD. And we see that Ignaz got a refund for one of the 3 products they ordered three days earlier.
A common export will probably contain much more columns, but for the sake of clarity and demonstration, I’ve kept it small.
Dashboard.
Now that we have the data, we should start with the most important: what do we want to show or calculate.
Spreadsheet experts often call this Start at the End.
To fill the dashboard shown above, we need some chart showing daily sales, we need to sum up specific events, to get to sales and cost totals and we need to sum all refunds (in the dataset just one, though). We need to group some data to count how many unique entries there were and we need to find the best selling products.
We now have the source - the events - and a target - the dashboard. Next step is to add the intermediate calculations.
Lookup tables.
Lookup tables, or, in Event Source lingo Projections, have two purposes in our spreadsheet.
The first is to move all calculations that enrich, parse, or reformat events away from the events table. So that this table contains only the data exactly as it appears in our exports. The second is to make summaries, and -yes! There they are- pivot tables.
Our source data has several problems. One is that the timestamps use an ISO standard, which Google sheets cannot parse (yes! Google sheet cannot parse the one and only official international standard way to write dates. Really). The other is that prices are in different currencies. And we want to calculate with the exchange rates as they happen on the day of the transaction. We certainly cannot just sum price in EUR with one in USD. Often you’ll need to parse, enrich or add much more data.
Again, it is unwise to do this in the “events” table. That makes copy-pasting very clumsy, it increases the chance of accidentally overriding and it spreads your code (formulas) all over. Let’s keep the events tab “append only”: no calculations there!
Using
QUERY
we can pull the data into another tab. This one I called lookup_sales_events.
I prepend all my “lookup tables” to clarify their purpose. And to make clear
that this is not a place to insert data. Lookup tables too are “read only”.
The query here is ` =QUERY(events!A1:J1001, “where J = ‘sale’”), which selects all
events whose type is sale`, with all its columns from the events.
A similar tab is added for refund.
Right of this tab I’ve added some enrichments. One is an ugly hack to parse the
ISO dates, another to calculate the EUR version of any USD-priced event, using
GOOGLEFINANCE Currency
conversions
One of the mentioned technical issue surfaces here: if we were to add events,
the right columns won’t grow with it automatically. We would miss this data
without seeing an error! The solution adds complexity to the Demo, but would
include additional logic in the formulas like IF(ISEMPTY(), "", [the current
formula]). And even then, it only goes so far as we’ve dragged the right hand
range to. If we dragged it to row 500 and we insert the 501st (actually, the
498th, we have two header rows) “sale” event, we will miss it and might not
notice it! Stay vigilant!
Such projections are also the ideal place to deduplicate any events, in the exceptional case that it is impossible to avoid duplicating during entering.
For my overview I like to format this table a little, add some lines, headers, colors etc.
I’m personally a big fan of adding aggregates[5] of a column, such as sums, averages etc above the table. This makes it much easier to let the table grow down (which it will if we add more events) and always reference to the same cell for an aggregate. Other people prefer to put such aggregates in their own sheet. Whatever rocks your boat.
Some common formulas used to build such lookup tables are QUERY(),
FILTER(), UNIQUE() and IMPORTRANGE(). The last one is great when you want
your Event Source to be a separate sheet or even CSV file stored somewhere else.
For the sums, averages, etc the common formulas are COUNTIF, SUMIF or SUM(FILTER()) etc.
Another common type of lookup table can be found in the demo under lookup_products. Which counts the amount of products sold.
For this we use COUNTIF and UNIQUE to count occurrences
I chose to build this lookup table from another lookup table. Generally I try to avoid such inference and try to have each lookup_table use only the Event Source as source. But that would complicate and duplicate the formulas to filter only on “sale” events. It’s a trade-off.
And a third type of lookup is a so-called pivot table. Such a table groups data by one column, calculates aggregates over the groups and presents that in another table. Under lookup_pivot_daily_sales we group by day, and calculate the total amount of sales for each day. Used to then generate the chart on the Dashboard. To make this pivot-table a tad simpler, I added a date column to the sales_events. This can be done in the pivot table too, but this makes the already difficult to grasp pivot table even harder to grasp. Like above, I chose to use another lookup_table as source. Same trade-off.
Dashboard again
From here we can go back to the dashboard fill in all the data, add a chart,
and QUERY() the top grossing products. My rule of thumb is to avoid any logic
and calculations on the dashboard: just presentation, nothing more. I violated
this a little, with summing the income and costs and negating the costs.
Normally I would make another sheet where I calculate this, and then only
reference this from the dashboard. But that would complicate the demo. So I
left it for a next round of refactoring.
Future
With the events as data-source, we should have all data to calculate any possible projection onto our dashboard. Just add one or more lookup-tables to prepare the data, then refer to the outcome in that projection in a dashboard.
Need a monthly summary? Follow the pattern that we already have for our daily sales.
Need a date-range? Add a form (just one or two cells with a different color, or a dropdown) to the dashboard and use that to select a subset of the events, and either fill another projection with that data, or simply use the value in that field as parameter in a formula.
Sometimes, however, we will need data that don’t yet have and that isn’t in our events. These basically fall in two categories:
- Events from now on have an additional field holding this data.
- Events that we don’t yet have.
- We need another lookup table or external data source to enrich this data.
For example we may want to add to our dashboard from which country a sale was made and our events lack a country, IP-address or something that can be used to provide this country. If we can get the provider to now add that field, we will have a list of events without that data, and a list of events with it. Even if the provider fills our previous events with this data in the export, it is probably not smart to start overwriting the existing events. In Event sourced software this generally is not possible and most often “forbidden” even: events are read-only, the list is append-only. We should never change past events. We should never delete past events.
In our spreadsheet it is possible, but still unwise, as a lot of projections or
calculations may (and will) break the moment our source table suddenly has
columns shifted or changed. It is far easier to add a new tab with e.g.
v3_events or whatever versioning you want. Then add a projection sheet which
combines all source events tabs and normalizes them. Using complex QUERY()
formulas. The benefit is that all normalization, filtering, parsing, again,
happens in the projections and nowhere else.
A second example may be when we need to extend our dashboard with data on how fast orders are delivered to the doorstep. For that we will need additional events. Events that our delivery service or postal service may have. Many will provide a CSV export that we could use as “events” and from which we can then project and calculate the time of delivery.
The third example may be when we do have said IP-address in the export but up
to now never used it. And we want to get the country from that. Via some
GeoIP lookup service (some of which even have addons for popular spreadsheet
software), we could then fetch the country for an IP address in a lookup
table.
So, any future extension is done with either more fields on existing events, additional events, or with more projections.
Need the amount of days that we didn’t sell? A projection. Average order size? Projection. Recurring customers? Projection. And so on. Once the structure is established, extending it, is mostly following a pattern.
Conclusion
Spreadsheets can be kept clean, clear, extendable, by organizing them with ideas from Event Sourcing.
This is by no means fully or even properly Event Sourced software. It is, however, an architecture to clearly distinguish logic from input from presentation in a spreadsheet. And to make extending it in future predictable and relatively easy.
It keeps the logic in a simple place. It reduces the amount of indirections (references to other cells and other calculations) minimal and flat. And it gives you a clear place where to copy and paste new entries.
- [1] More sophisticated, but omitted from the demo here because of complexity, is to import, or link to, such exports. The “Event Source” then becomes a CSV file, or list of files in a directory somewhere. This greatly eases the “data inserts” as all you need to do, is download the export and plonk it in the right directory with the right name.
- [2] I’m not enough of an excel guru to know if you can actually make a sheet “append only”, but just documenting this, is enough, in my experience. If you don’t trust the users of the sheet to follow the guidelines, a spreadsheet really is the wrong tool to begin with.
- [3] Appending at the bottom is much easier than inserting rows at the top. The oldest entry then sits at the top, and newer ones get added below. But inserting at the top is certainly possible, just more work and more chances of accidentally overwriting data.
- [4] There are solutions to this, though. One is a common bookkeeping practice to “close the books”. In Event Sourcing, this is solved with snapshots. Both, in essence, insert an additional event which says “all events up to here can be summarized with the following data:” and then includes that data. With a spreadsheet, I generally copy the sheet every year, insert one or more event that sets all the opening balances copied from on the previous sheet, and I’m good to go.
- [5] For clarity: in DDD, which is often mentioned alongside of ES, an Aggregate has a different meaning. Here an Aggregate is just a calculated value from a column. Such as the sum of all prices or an average or a count.